Slumping Economies Abroad; New Historical Extremes in the U.S.
Summary
The prices of U.S. stocks continued to rise throughout August based on surprisingly positive 3Q GDP projections, accommodative monetary policy signals (with the market interpreting Chairman Powell’s most recent remarks as being dovish), and apparently successful trade negotiations with Mexico. Against this gentle rise, however, we continue to see historical extremes in terms of asset multiples in the U.S., along with (i) depreciating global currencies that are now threatening to enter into a full-blown emerging markets currency crisis; (ii) sharply falling volume for U.S. home sales; and (iii) increasingly recessionary signals for the U.S. economy going forward 6-12 months.
Looking at the market for U.S. equities in terms of long-term, medium-term, and short-term metrics and indicators, current conditions demonstrate an ambiguous short-term outlook, a clearly positive medium-term outlook, and an extremely negative long-term outlook. In fact, the market is experiencing the most extraordinarily overvalued extremes in history, which are strongly correlated with poor (i.e., likely negative) 10-12-year nominal future returns. Short summaries of the three types of indicators are given below.
A Wildly Overvalued Stock Market
Lately we have seen an increasing number of research reports and big name asset managers predicting very bad things coming up ahead, but because market timing is so difficult, few dare make any claims about left-tail risk prior to mid-2019. Nonetheless, as John P. Hussman has taken to repeating lately: “This market is going to collapse, and everyone knows it.” By any reasonable measure, the U.S. stock market is wildly overvalued.
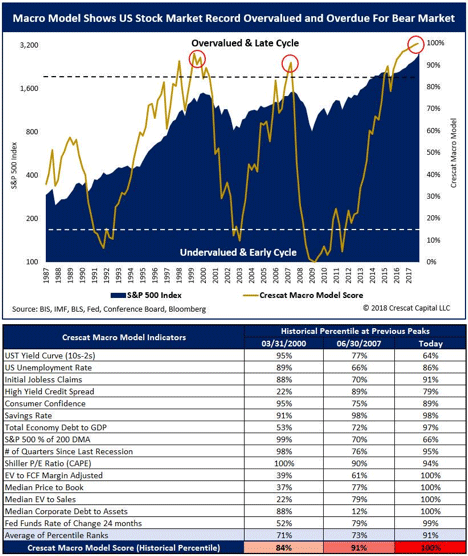
Macro Model Shows US Stock Market Record Overvalued and Overdue for Bear Market
By the margin-adjusted CAPE developed by Hussman himself (one of Sparrowhawk Media’s two favored long-term indicators), the indicator reached an all-time high near 48 on Wednesday, August 29, 2018.
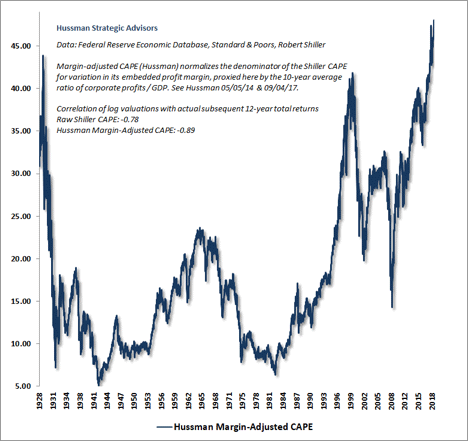
Graph of Hussman Margin-Adjusted CAPE
This is the so-called “everything bubble” that we have been warned about following the extraordinary monetary policies that have been pursued since the financial crisis of 2008.
The U.S. as an Island of Investment Stability
So far, the U.S. markets have operated as an island of investment stability for global investors seeking to avoid frail economies around the world. Emerging markets are in trouble, and recent news stories trumpet the possibility of a full-blown global currency crisis related to countries such as Brazil, India, Indonesia, Turkey, and South Africa, to say nothing of signs of economic contraction from China as it risks heading into a trade war with the Trump Administration. The result has been anomalous investment returns for U.S. equities, despite having pursued similar monetary policies.
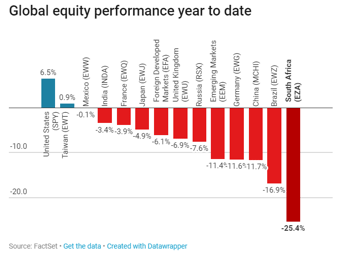
Graph of Global Equity Performance Year-to-Date
As mentioned in last month’s newsletter, there is a related phenomenon occurring in the bond markets, where Bill Gross and others have claimed the existence on an investment opportunity where U.S. bond yields must at some point converge closer to those of Europe. So far, however, this has not occurred. Corporations still have a massive amount of cash without having a whole lot of projects for business investments, and this has resulted in an enormous amount of distortion via corporate stock buybacks. A recent chart from Lance Roberts of Clarity Financial illustrates the point in terms of financial accounting:
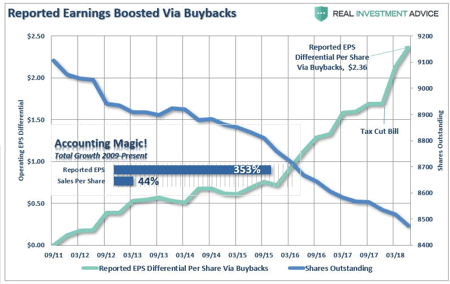
Graph of Reported Earnings Boosted via Buybacks
In other words, the blockbuster EPS growth numbers commonly reported in the financial news media often distort the true picture of corporate profit growth, and are much less reliable (especially over the past several years) than other metrics such as gross revenues.
That caveat aside, it must also be admitted that real economic GDP growth in the U.S. has consistently surprised on the upside for most of the year 2018. China announces 25% tariffs, and the markets have shaken it off. Rumors of trade disruptions are heard concerning U.S. trade with Mexico, Canada, and/or the EU, and the economy ignores the noise. The Mueller investigation continues to obtain indictments and guilty pleas, and there is no observable market effect. The volume of home sales drops, and yet there is no discernable impact on net private U.S. wealth. All the while, the yield on 10-year U.S. Treasuries, which had threatened to derail the bull market in equities near the beginning of this year, have moderated along with wage and consumer inflation expectations, which so far have not materialized as strongly as expected. So an already wildly overvalued market climbs even higher.
III. Recessionary Signals on the Horizon
Nevertheless, the indicators of an impending recession in early- to mid-2019 have been growing much stronger in recent weeks. As mentioned above, the slumps in markets abroad could eventually affect the U.S. markets, and this is partly related to the large drop in demand for U.S. residential real estate. Inflation has so far been kept to moderately low levels, but the yield curve continues to flatten, with the 10-to-2-year spread for U.S. Treasuries recently dipping temporarily below 0.20%. Clever artificial intelligence (AI) algorithms, such as the one below from Bloomberg, are now flashing warning signals.
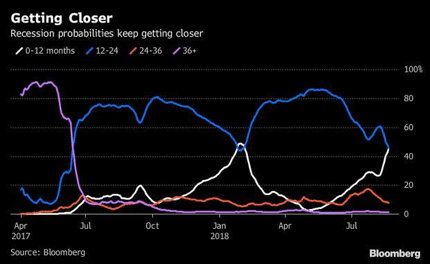
Graph of Recession Probabilities. Source Bloomberg
Additionally, in terms of consumer inflation growth and manufacturing activity, there are leading indicators that suggest that recently reported figures may be hiding underlying weaknesses that are already occurring:
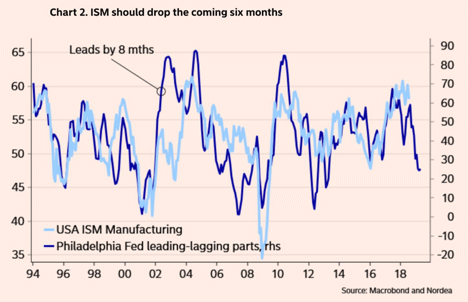
Graph of ISM should Drop in 6 Months. Source Macrobond and Nordea
Admittedly, this type of information is more speculative than other more reliable metrics investors use to make their investment decisions, and so a cautious posture toward continual monitoring is warranted. As always, investors should strive to exhibit maximum flexibility and agility in the coming months as market conditions dictate.
Categories: Monthly Wrap Up
